The 3 AM Page That Changed How We Monitor Systems
I got paged at 3 AM. "API is slow." That's all the alert said.
I opened our monitoring dashboard. CPU? Normal. Memory? Normal. Database? Normal. Everything looked fine.
But users were experiencing 5-second response times. Something was broken. I just had no idea what.
I spent 2 hours clicking through dashboards, checking logs, guessing. Finally found it: one microservice was making 100 database queries per request instead of 1. Recent deploy introduced an N+1 query bug.
That night I learned: monitoring tells you WHAT is broken. Observability tells you WHY.
The Three Pillars of Observability
1. Logs (What Happened)
"User X tried to checkout at 3:15 AM. Payment failed with error: insufficient funds."
Logs are stories. They tell you events that occurred.
2. Metrics (How Many, How Often)
"API latency p99 is 2.5 seconds. Error rate is 5%. Requests per second: 1000."
Metrics are numbers over time. They tell you trends and patterns.
3. Traces (The Journey)
"Request came in → called Auth Service (50ms) → called Product Service (200ms) → called Database (2000ms) ← HERE'S THE SLOWDOWN."
Traces show the full path of a request across services. They tell you where time is spent.
What We Actually Use
Logs: ElasticSearch + Kibana. Every service sends logs here. Searchable, filterable.
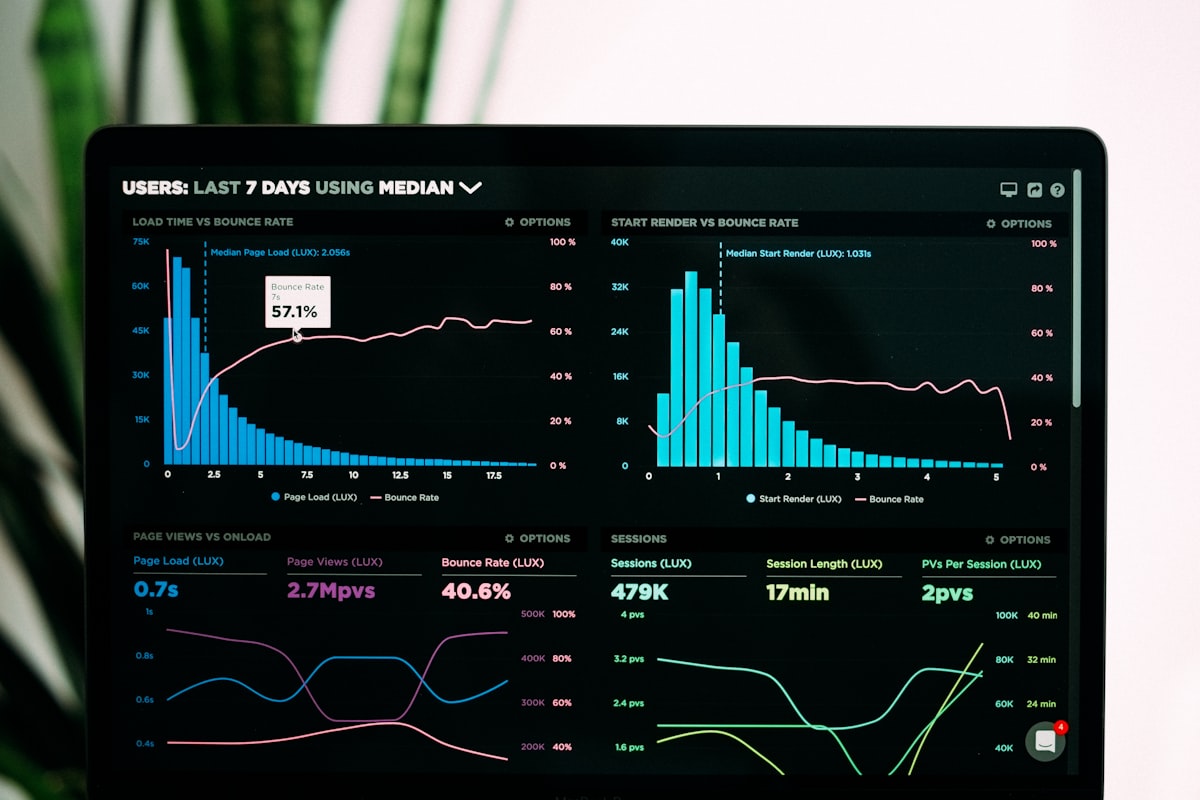
Metrics: Prometheus + Grafana. Tracks latency, error rates, throughput. Pretty dashboards.
Traces: OpenTelemetry + Jaeger. Shows request flow across microservices.
Together? I can debug that 3 AM issue in 5 minutes instead of 2 hours.
The Game-Changer: Correlation
The magic happens when you connect all three.
Alert fires: "High latency on /checkout endpoint."
- Metrics dashboard → p99 latency spiked to 5s
- Traces → shows Payment Service is slow
- Logs → Payment Service logs show "Stripe API timeout"
Root cause found in 60 seconds: Stripe is having an outage. Not our fault. We add a status page note and go back to sleep.
Start Simple
Don't build Netflix-level observability on day 1. Start with:
- Structured logging: Log in JSON. Include request ID in every log.
- Basic metrics: Track requests, errors, latency. Even just counting these helps.
- One trace: Instrument your slowest endpoint. See where time goes.
You'll catch issues faster. Sleep better. And when you get paged, you'll know WHY, not just WHAT.
